

The right to functional sexual and reproductive health includes the right to adequate perinatal care. The World Health Organization (WHO, 2020) has addressed reproductive health as the reproductive processes, functions, and system at all stages of life. Reproductive health rights mean women have the right to access healthcare centers that can facilitate safe pregnancy and childbirth.
Several studies have shown that self-rated health has a strong association with mortality, and this is not related to a known background disease (McFadden et al, 2009). These findings suggest that a self-rated health assessment is a valuable source of information regarding subjective health status.
Although there are many benefits to Swedish maternal healthcare, which influences the self-rated health of pregnant women, there are many factors that influence self-rated health, including physical and emotional symptoms of pregnancy (Schytt and Waldenström, 2007; Schytt and Hildingsson, 2011; Henderson and Redshaw, 2013). In general populations, factors known to be associated with self-rated health include gender, income, education, employment status, culture and health behaviors (Layes et al, 2012).
In pregnant women, reported factors associated with poorer self-rated health include psychological stress, high body mass index and past smoking (Christian et al, 2013). Immigrants and foreign-born women of reproductive age have also been shown to report lower self-rated health in the Swedish population (Eurenius et al, 2011; Henriksson et al, 2020), the Canadian population (Mechakra-Tahiri et al, 2007) and women from the Netherlands (Schoevers et al, 2009).
The importance of studying self-rated health cannot be over-emphasised, considering that it can predict future morbidity in women after childbirth (Cheng and Li, 2008) and early feeding difficulties (Webb, 2018). It is important that women are given the chance to express, prioritise and evaluate different aspects of their health, including their overall health, as it gives an insightful picture of women's views (Layes et al, 2012).
Although the concept of self-rated health is considered to be simple and easy measure of general health (Bombak, 2013), its complex relation to health-related behaviors has resulted in assessments mixing self-rated health with behaviours such as smoking, physical activity and dietary assessments (Delpierre et al, 2009).
Self-rated health in women with low-risk pregnancies is understudied in Sweden, although these women constitute the majority of all pregnancies (Sandall et al, 2016). Although studies from Sweden (Ny et al, 2007) and other European countries (Feijen-de Jong et al, 2015) have shown that the attendance rates of low-risk pregnant women at prenatal healthcare are low, most women in Sweden have high compliance to prenatal healthcare in general. Approximately 99.9% of all pregnant women attend primary midwifery-led healthcare and 99.9% deliver in hospitals (Zielinski et al, 2015).
Self-rated health is a subjective description that refers to how a person perceives their overall health status (Deeg and Kriegsman, 2003), building on a single question that asks patients to rate their general health on a scale ranging from excellent to poor (Fayers and Sprangers, 2002). It is the authors' view that research using the comprehensive population register data in Sweden to examine the self-rated health of pregnant women is limited. The aim of this study was to examine sociodemographic factors associated with self-rated health before, during and after pregnancy in low-risk pregnant women. Standardised and validated measures were used and women from all 22 counties and municipalities in Sweden were represented.
Methods
Design
This was a retrospective analysis of the Swedish pregnancy register (Graviditetsregistret ©), containing data regarding pregnancy and deliveries in Sweden during 1 January 2010 to 31 December 2015. The last published validity study in this series investigated the degree of coverage and internal validity of specific variables in the pregnancy register (Petersson et al, 2014) and demonstrated a good to very good degree of coverage, agreement between medical records and the pregnancy register database (Graviditetsregistret ©) and internal validity.
In this study, self-rated health was built on the definition used in the Swedish pregnancy register (Graviditetsregistret, 2014). The data in the current register are from standardised electronic journal systems where a woman's health status is either self-reported or measured and reported by midwives and/or medical practitioners (Graviditetsregistret, 2017). In this definition, self-rated health means that the woman assessed her general health condition as she experienced it 3 months before pregnancy (retrospectively), during pregnancy (at admission, between pregnancy weeks 10 and 12), and approximately 8 weeks after birth (at the postpartum control visit) by answering the question ‘how was your general health condition during the last 3 months before you became pregnant?’ or ‘how is your general health condition right now?’.
Participants
All women gave their consent to enter their data in the pregnancy register at their admission visit to the midwife. Data from a total of 462 169 women who were registered in the database between 2010 and 2015 were available for analysis. After identifying missing data, the database was rinsed so that only those with reported self-rated health on all three occasions, before, during and after pregnancy, were analysed. The data were also limited to low-risk pregnancies. After these procedures, the remaining database included 167 523 participants that were used in further analyses. All steps of exclusion are presented in a flowchart in Figure 1.
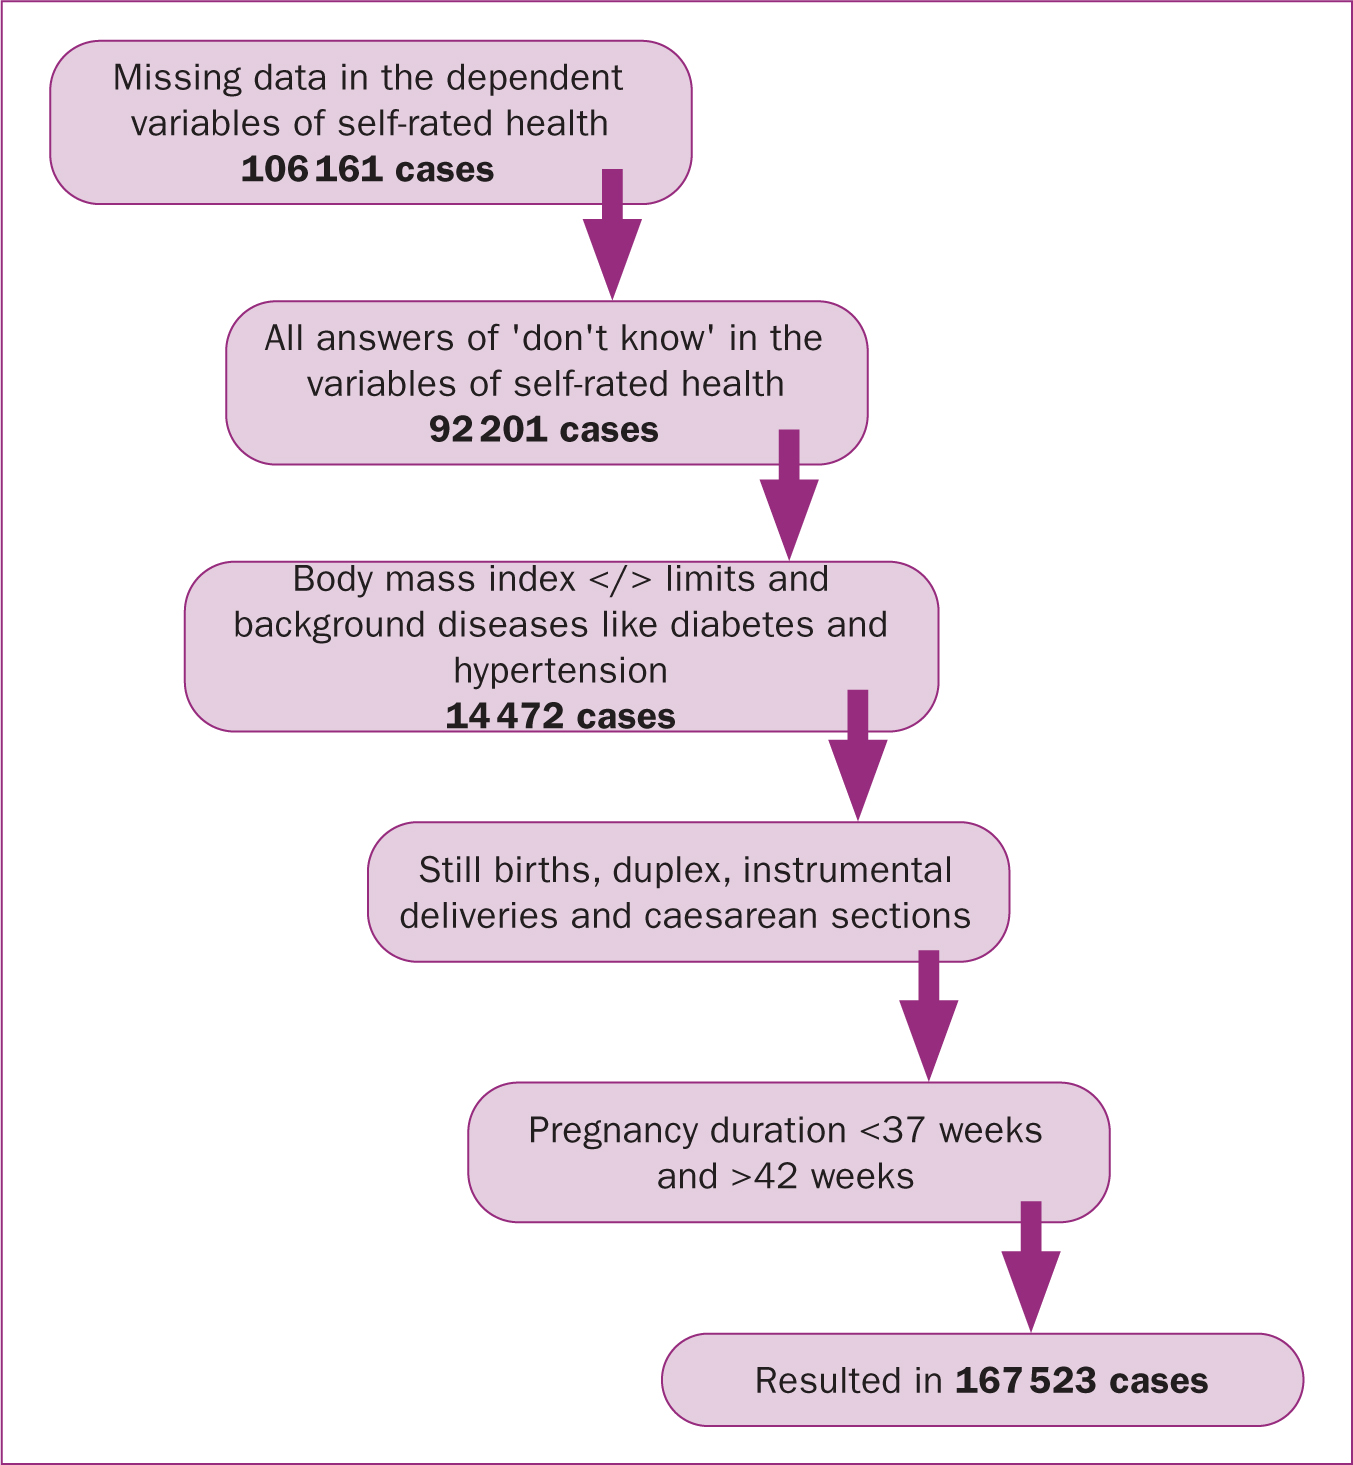
Based on the Board on Children, Youth and Families et al (2013), low-risk pregnancies were identified in the population as pregnancies resulting in the birth of a living single child within normal gestational age (between full 37 weeks and 42 weeks) according to sonar estimation. The inclusion criteria were that women did not have a chronic disease (diabetes, hypertension, kidney insufficiency, epilepsy; or cardiovascular disease) during pregnancy and had a boddy mass index of less than 35 at admission. Women who had a vaginal delivery without instruments were included. All caesarean sections and instrumental births (vacuum extraction, forceps) were excluded. The main reason for this exclusion criterion was to eliminate possible factors related to birth that could influence self-rated health after pregnancy. Women were questioned regarding their self-rated health in their 8-week postpartum consultation with a midwife.
Data analysis
The Statistical Package for Social Sciences (version 23) was used to analyse the data. The first step was to re-categorise the variables of interest and rinse the data. This was followed by a pre-analysis that aimed to check for assumptions behind further chosen analyses. P<0.01 was the lowest limit for statistical significance in all analyses.
In a large population study, it is easy to produce significant differences, therefore, the data could be treated as normally distributed (Ghasemi and Zahediasl, 2012). In order to calculate differences between women with low self-rated health (rated as bad) and women with high self-rated health (rated as good), and to check whether the independent variables had any meaningful relation to the dependent variable, group comparisons were performed where self-rated health became the grouping variable. For quantitative normally distributed data, the parametric test independent t-test was used. Non-parametric tests were used for ordinal variables (Mann-Whitney U-test) and nominal variables (Chi squared test).
In the final step, ordinal regression analysis was performed, which started with a univariate analysis before multivariate regression analysis was identified in which all variables of interest were entered, regardless of the outcome in the univariate analysis measurement (Chan, 2004). For ordinal regression analyses, thresholds between the categories very good, good, neither good or bad, and bad were used for dependent variables of self-rated health before, during, and after pregnancy. Both odds ratios and 95% confidence interval for odds ratios were reported (Sheldon, 2000a). The significance level was pre-set at 0.05 and could not be adjusted as a result of the chosen analysis method in the software: ordinal regression analysis.
Ethical considerations
The data handled in this study were available for the research team after ethical board approval (Lund University Ethical Board ref: 2016/234) from the data register holder. After defining objectives, variables of interest and the rationale of the planned project, the required data without personal information were received by the researchers. The code list for the unidentified material, where serial numbers replaced security social numbers and names, was kept with the registry holder and was not requested. All processing and storage of data took place on computer and an external storage medium without connection to the internet, as recommended by the ethical board.
Results
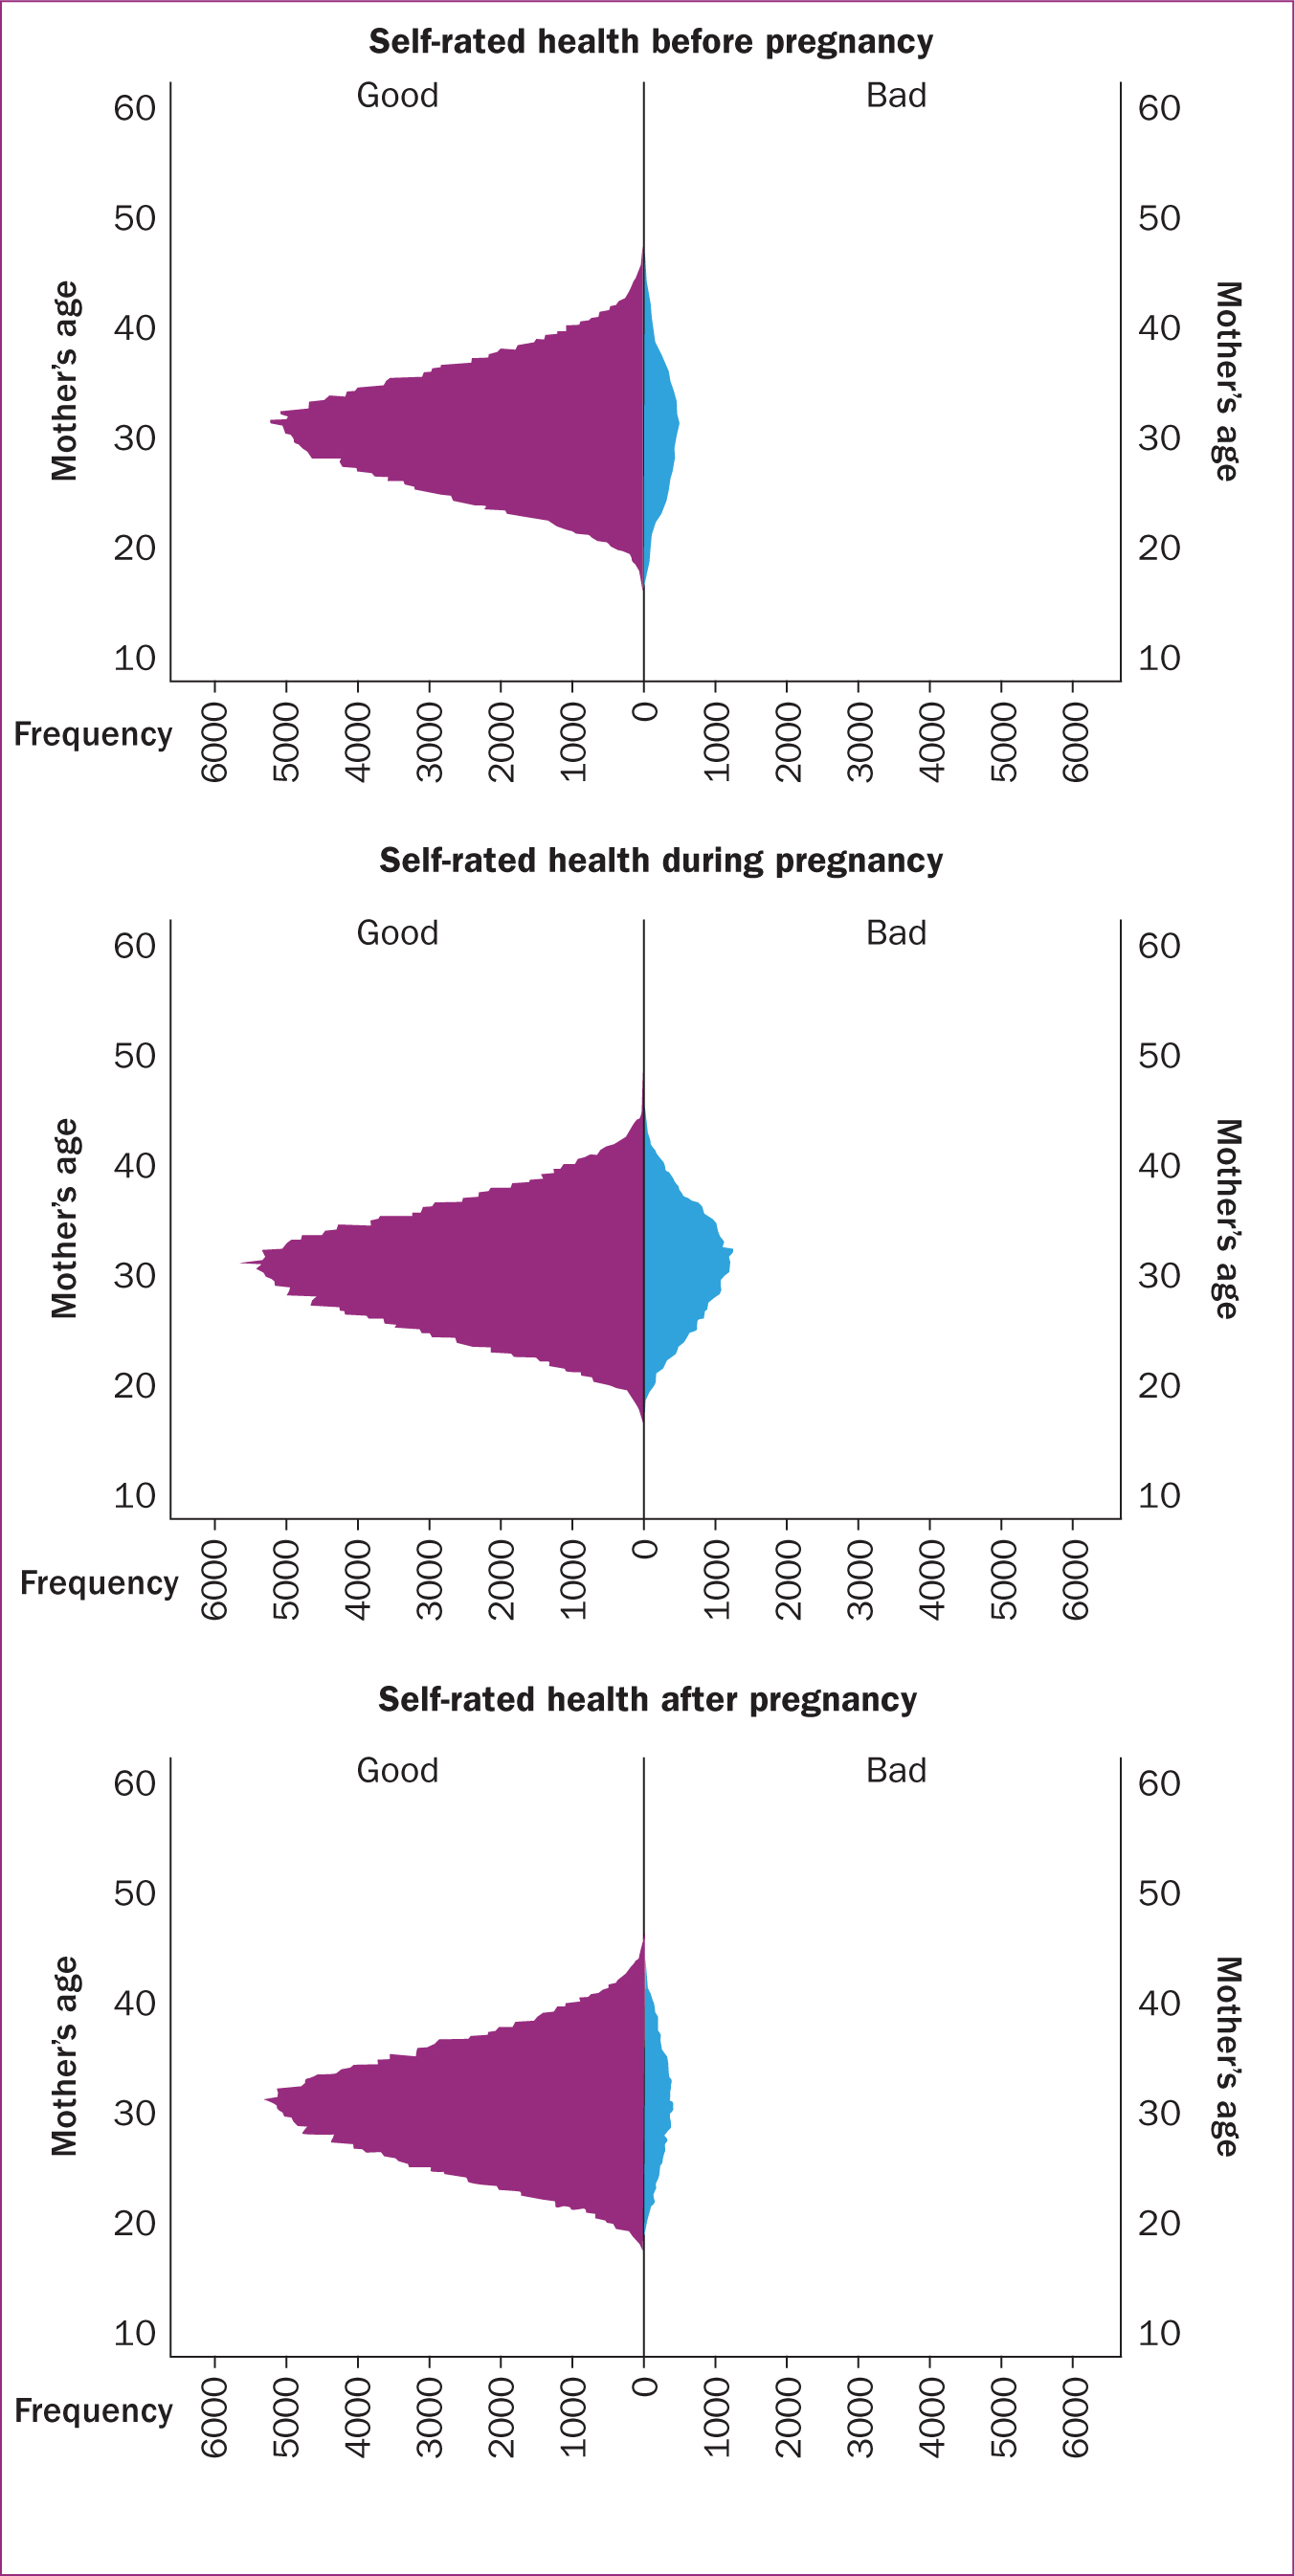
Tables 1 –3 outline the results of multivariate analysis of sociodemographic factors and self-rated health before (Table 1), during (Table 2) and after (Table 3) pregnancy. The mean age of the studied low-risk population at admission was 30.5 years (standard deviation: 5.0) regardless of how they rated their health, and the mean body mass index at admission was 24.2 (standard deviation: 3.5), both indicating normal distribution. The distribution and correlation between age and self-rated health before, during and after pregnancy revealed that more women rated their health as bad during pregnancy compared to before and after pregnancy (Figure 2).
Table 1. Dichotomised data on variables in relation to self-rated health 3 months before pregnancy
| Variable | Category | Self-reported health before pregnancy | P | value Odds ratio (95% confidence interval) | |
|---|---|---|---|---|---|
| Good, n=152 046 | Bad, n=15 477 | ||||
| Age (years) | <24 | 21 746 (14.3) | 2700 (17.4) | 0.747 | 1.01 (0.94–1.08) |
| 25–29 | 48 786 (32.1) | 4503 (29.1) | 0.004 | 0.95 (0.91–0.98) | |
| 30–34* | 529 446 (34.8) | 5016 (32.4) | - | 1 | |
| >35 | 28 568 (18.8) | 3258 (21.1) | <0.001 | 1.10 (1.05–1.15) | |
| Body mass index at admission | Normal (<24.99)* | 100 272 (65.9) | 8980 (58.0) | - | 1 |
| Overweight (25-29–99) | 39 648 (26.1) | 4500 (29.1) | <0.001 | 1.15 (1.10–1.19) | |
| Obesity grade I (30–34.99) | 12 126 (8.0) | 1997 (12.9) | <0.001 | 1.36 (1.26–1.46) | |
| Parity | Primipara | 62 808 (41.4) | 5999 (38.8) | <0.001 | 0.92 (0.90–0.94) |
| Multipara* | 89 045 (58.6) | 9456 (61.2) | - | 1 | |
| Country of birth | Scandinavia* | 123 947 (85.2) | 11 592 (78.9) | - | 1 |
| Other | 21 577 (14.8) | 3096 (21.1) | <0.001 | 1.24 (1.20–1.28) | |
| Education | Primary or lower | 20 050 (13.2) | 3508 (22.7) | <0.001 | 1.37 (1.34–1.40) |
| Secondary | 55 018 (36.2) | 62 127 (40.2) | <0.001 | 1.89 (1.83–1.95) | |
| University or higher* | 76 713 (50.5) | 5725 (37.1) | - | 1 | |
| Employment | Employed* | 115 403 (75.9) | 9393 (60.7) | - | 1 |
| Jobseeker | 9457 (6.2) | 2026 (13.1) | <0.001 | 1.78 (1.71–1.86) | |
| Parental leave | 12 420 (8.2) | 2080 (13.4) | <0.001 | 1.33 (1.28–1.38) | |
| Student | 14 705 (9.7) | 1971 (12.7) | <0.001 | 1.40 (1.35–1.45) | |
| Alcohol consumption 3 months before pregnancy | Risky behaviours | 22 035 (14.1) | 1780 (15.8) | <0.001 | 1.23 (1.19–1.26) |
| Non-risky behaviours* | 134 234 (85.9) | 9474 (84.2) | - | 1 | |
| Smoking 3 months before pregnancy | Smoker | 17 000 (11.3) | 2894 (18.9) | <0.001 | 1.48 (1.43–1.52) |
| Non-smoker* | 133 387 (88.7) | 12 393 (81.1) | - | 1 | |
| Snuff 3 months before pregnancy | Yes | 5530 (3.6) | 635 (4.1) | 0.003 | 1.10 (1.03–1.17) |
| No* | 146 516 (96.4) | 14 842 (95.9) | - | 1 | |
Table 2. Dichotomised data on variables in relation to self-rated health during pregnancy
| Variable | Category | Self-reported health during pregnancy | P value | Odds ratio (95% confidence interval) | |
|---|---|---|---|---|---|
| Good, n= | Bad, n= | ||||
| Age (years) | <24 | 20 101 (14.7) | 4345 (14.1) | 0.747 | 1.01 (0.94–1.08) |
| 25–29 | 44 083 (32.2) | 9206 (29.9) | 0.004 | 0.95 (0.91–0.98) | |
| 30–34* | 47 183 (34.5) | 10 779 (35.0) | - | 1 | |
| >35 | 25 343 (18.5) | 6483 (21.0) | <0.001 | 1.10 (1.05–1.15) | |
| Body mass index at admission | Normal (<24.99)* | 91 034 (66.6) | 18 218 (59.1) | - | 1 |
| Overweight (25-29–99) | 34 993 (25.6) | 9155 (29.7) | <0.001 | 1.15 (1.10–1.19) | |
| Obesity grade I (30–34.99) | 10 683 (7.8) | 3440 (11.2) | <0.001 | 1.36 (1.26–1.46) | |
| Parity | Primipara | 59 290 (43.4) | 9517 (30.9) | <0.001 | 0.92 (0.90–0.94) |
| Multipara* | 77 233 (56.6) | 21 268 (69.1) | - | 1 | |
| Country of birth | Scandinavia* | 110 878 (84.8) | 24 661 (83.8) | - | 1 |
| Other | 19 914 (15.2) | 4759 (16.2) | <0.001 | 1.24 (1.20–1.28) | |
| Education | Primary or lower | 18 786 (13.8) | 4772 (15.5) | <0.001 | 1.37 (1.34–1.40) |
| Secondary | 48 950 (35.9) | 12 285 (39.9) | <0.001 | 1.89 (1.83–1.95) | |
| University or higher* | 68 736 (50.4) | 13 702 (44.5) | - | 1 | |
| Employment | Employed* | 103 063 (75.4) | 21 733 (70.5) | - | 1 |
| Jobseeker | 8865 (6.5) | 2618 (8.5) | <0.001 | 1.78 (1.71–1.86) | |
| Parental leave | 11 109 (8.1) | 3391 (11.0) | <0.001 | 1.33 (1.28–1.38) | |
| Student | 13 612 (10.0) | 3064 (9.9) | <0.001 | 1.40 (1.35–1.45) | |
| Alcohol consumption before pregnancy | Risky behaviours | 19 277 (14.1) | 4538 (14.7) | <0.001 | 1.23 (1.19–1.26) |
| Non-risky behaviours* | 117 433 (85.9) | 26 275 (85.3) | - | 1 | |
| Smoking at admission | Smoker | 5414 (4.0) | 1955 (6.4) | <0.001 | 1.48 (1.43–1.52) |
| Non-smoker* | 130 807 (96.0) | 28 720 (93.6) | - | 1 | |
| Snuff at admission | Yes | 1032 (0.8) | 355 (1.2) | 0.003 | 1.10 (1.03–1.17) |
| No* | 120 905 (88.4) | 27 037 (87.7) | - | 1 | |
Table 3. Dichotomised data on variables in relation to self-rated health after pregnancy
| Variable | Category | Self-reported health after pregnancy | P value | Odds ratio (95% confidence interval) | |
|---|---|---|---|---|---|
| Good, n=156269 | Bad, n=11254 | ||||
| Age (years) | <24 | 22 800 (14.6) | 1646 (14.6) | 0.189 | 0.96 (0.90–1.02) |
| 25–29 | 49 983 (32.0) | 3306 (29.4) | 0.001 | 0.94 (0.91–0.98) | |
| 30–34* | 54 119 (34.6) | 3843 (34.1) | - | 1 | |
| >35 | 29 367(18.8) | 2459 (21.9) | 0.087 | 0.96 (0.92–1.01) | |
| Body mass index at admission | Normal (<24.99)* | 102 399 (65.5) | 6853 (60.9) | - | 1 |
| Overweight (25-29–99) | 41 030 (26.3) | 3117 (27.7) | 0.078 | 1.03 (1.00–1.07) | |
| Obesity grade I (30–34.99) | 12 840 (8.2) | 1283 (11.4) | 0.116 | 1.06 (0.99–1.14) | |
| Parity | Primipara | 64 158 (41.1) | 4649 (41.4) | <0.001 | 0.96 (0.94–0.98) |
| Multipara* | 91 907 (58.9) | 6594 (58.6) | - | 1 | |
| Country of birth | Scandinavia* | 126 922 (84.9) | 8617 (80.4) | - | 1 |
| Other | 22 578 (15.1) | 2095 (19.6) | <0.001 | 1.39 (1.35–1.43) | |
| Education | Primary or lower | 21 651 (13.9) | 1907 (17.0) | <0.001 | 1.24 (1.20–1.28) |
| Secondary | 56 876 (36.4) | 4359 (38.8) | <0.001 | 1.12 (1.09–1.14) | |
| University or higher* | 77 471 (49.7) | 4967 (44.2) | - | 1 | |
| Employment | Employed* | 117 224 (75.0) | 7572 (67.3) | - | 1 |
| Jobseeker | 10 399 (6.7) | 1084 (9.6) | <0.001 | 1.46 (1.40–1.52) | |
| Parental leave | 13 213 (8.5) | 1287 (11.4) | <0.001 | 1.32 (1.27–1.37) | |
| Student | 15 368 (9.8) | 1308 (11.6) | <0.001 | 1.28 (1.24–1.33) | |
| Alcohol consumption before pregnancy | Risky behaviours | 22 035 (14.1) | 1780 (15.8) | <0.001 | 1.11 (1.08–1.14) |
| Non-risky behaviours* | 134 234 (85.9) | 9474 (84.2) | - | 1 | |
| Smoking in pregnancy weeks 30–32 | Smoker | 4961 (3.2) | 622 (5.6) | <0.001 | 1.37 (1.30–1.44) |
| Non-smoker* | 150 949 (96.8) | 10 580 (94.4) | - | 1 | |
| Snuff in pregnancy weeks 30–32 | Yes | 692 (0.5) | 260 (1.0) | <0.001 | 1.34 (1.18–1.51) |
| No* | 135 852 (99.5) | 30 509 (99.0) | - | 1 | |
When categorising age, the majority of those who rated their health as good before, during, and after pregnancy were between 25 and 34 years old. However, the same age groups represent the majority of those who rated their health as bad. Similar findings were shown with regards to body mass index (normal weight, overweight, and obesity grade 1), with the normal weight group being the most represented group in both those who rated their health as good and those who rated it as bad.
The multiple ordinal regression analyses showed that women between 25 and 29 years old were less likely to rate their health lower before, during, and after pregnancy (odds ratios=0.95, 0.94 and 0.94 respectively) compared to those aged 30 to 34 years. Contrarily, those aged 35 years or older estimated their health to be lower before pregnancy (odds ratio= 1.10) compared to 30–34-year-old pregnant women. Furthermore, overweight or obese women rated their health lower than normal weight women throughout the follow-up period (before, during, and after pregnancy), although without statistically significant evidence during and after pregnancy.
Primiparous women more often rated their health higher than multiparous women (odds ratio=0.92, 0.58 and 0.96 before, during and after pregnancy). Women born outside Scandinavia had a much higher risk for lower self-rated health throughout the follow-up period. Those educated to less than university level tended to rate their health lower before pregnancy, but the risk declined during and after pregnancy (odds ratio=1.89, 1.21 and 1.12 for those with secondary school level; 1.37, 1.23, and 1.24 for those with primary school level). Compared to employed women, those who were jobseekers, on parental leave or students reported lower levels of self-rated health before pregnancy, which then stabilised during pregnancy and increased again after pregnancy. Women with risky alcohol consumption behaviours, and those who reported smoking and/or snuffing had lower self-rated health compared with those with non-risky behaviours, non-smokers and those who did not report snuffing.
Discussion
This study aimed to examine sociodemographic factors associated with self-rated health before, during and after pregnancy in low-risk pregnant women based on the comprehensive population register data in Sweden. Previous studies have highlighted other important factors that influence self-rated health of women postpartum, including physical and emotional factors such as tiredness or musculoskeletal or depressive symptoms. These increase the risk of poor self-rated health in both primiparous and multiparous women (Schytt and Waldenström, 2007). A Swedish study reported that women with gestational diabetes mellitus had significantly poorer self-rated health after 4-year follow up (Persson et al, 2015). As midwives, it is important to be aware of factors associated with pregnant woman's self-rated health and bear them in mind when planning supportive actions in order to prevent poor outcomes. A couples' right to access healthcare centers that can enable safe pregnancy and childbirth is a basic human right (WHO, 2020). Thus, it is not only a responsibility, but should be a mission as midwives to make this promise a valuable lived experience for every woman and her partner during pregnancy and childbirth.
In the present study, women aged 35 years or older, who reported lower self-rated health before pregnancy, were more likely to report higher self-rated health after pregnancy, at a statistically significant level. This was compared to women aged 25–34 years old. This trend could be a result of fears of pregnancy-related complications or instability in social situations in younger women. Similar results were found by Molgora et al (2020) in their recently published study. Those aged 35 years and older comprised 20% of the study population and formed the group with the highest risk for rating their health lower than others before pregnancy. Increased age poses increased risk for mortality in the general population, by more than four times for those with poor compared to those with excellent self-rated health (McFadden et al, 2009).
Henderson and Redshaw (2013) similarly reported that young pregnant women are more likely to report positive outcomes postpartum. They also reported that a positive initial reaction to pregnancy was statistically significantly associated with positive outcomes for women after childbirth, regardless of their age. Comparing an initial positive reaction to pregnancy with self-rated health before pregnancy (as measured and reported in the present study), the present findings show a contradictive finding in which the self-rated health of women aged 35 years and older tended to be low before pregnancy but more positive after childbirth, reported as better self-rated health. This suggests that age influences self-rated health in both directions, positive and negative, which might lead professions working with sexual and reproductive health to improve the health and wellbeing of this group of women. Further qualitative studies with a more in-depth perspective on the experiences of pregnant women aged 35 years and older, and what matters to them when they rate their health, are needed to further guide preventive work for creating healthy conditions.
In the present study, women born outside Scandinavia rated their health lower than Scandinavian women. Knowledge of the relationship between migration and health of women of reproductive age has been increasing (Essén, 2001; Iglesias et al, 2003). However, contradictive findings regarding foreign-born women have been reported. They have been shown to report poor self-rated health to a larger extent than native women in a Swedish population (Fabian et al, 2008) but been at lower risk to transition to poor health compared to the native-born Canadian population (Newbold, 2005). However, there may be counfounding factors that influence self-rated health. A combination of younger age and unemployment, which is the status of many immigrant women in Sweden (National Board for Health and Welfare, 2016) as well as migration status could lead to not only lower self-rated health, but also negative outcomes after childbirth. Preventive actions are important and policymakers and stakeholders should develop existing regulations to improve the health of this group at a sustainable level. It is worth highlighting that Sweden has been rated the second-best country in the world in which to become a mother, despite minimal interventions taking place (Sandall et al, 2016). However, further studies are needed to better shed light on reasons for and contributing factors to experiences of Swedish healthcare among foreign-born women.
In the present study, primiparous women showed a tendency to rate their health better than multiparous women before, during and after pregnancy, which is in line with other studies' findings (Cooklin et al, 2015). Although self-rated health was measured until only approximately 8 weeks postpartum, the experience of a first childbirth could have long-term effects and an emotional impact on health-related quality of life, as reported in a Swedish study where 545 women were asked to rate their overall health-related quality of life 5 years after the birth of their first child (Carlander et al, 2015). These women perceived their health-related quality of life as high. Adding possible interventions, such as parent education provided in Swedish maternal healthcare, usually to primiparous women, the effect of interventions on self-rated health could be enhanced. In a British randomised controlled trial among 400 primiparous women, poor self-rated health was found to be significantly lower among the study group, who underwent an intervention, compared to the control group (Fisher et al, 2016). As an intervention, Fisher et al (2016) used and evaluated a gender-informed, psychoeducational programme for couples and babies to prevent common postpartum mental disorders. In Swedish maternal healthcare programmes, interventions such as parent education are warrantied for all interested couples free of charge. These programmes are regulated by Swedish law and have been since the early 1980s (Statens Offentliga Utredningar, 1980) and aim to prepare couples for their new role as parents (Olsson, 2010). The WHO (2020) recommends this for all women of reproductive age and their partners as part of basic human rights, specifically the right to accessible and affordable healthcare services that follow the couple's development and provide them the best chance of having a healthy infant.
Strengths and limitations
Sweden has an international reputation for good quality medical registers available for research (Nilsson et al, 2016). This gives the possibility to generalise results building on the often extensive available data at a low cost. However, one shortcoming of the current register database (Graviditetsregistret ©) is the lack of information on some basic variables such as postpartum bleeding and follow up of women with risky alcohol consumption behaviours and smoking habits. Another shortage is the lack of compliance with data collection from all maternal healthcare centres across the country. However, the results presented in this study cover all 22 regions and county councils in Sweden.
P values depend on the level of association and precision of the estimate (the sample size), which means that if the magnitude of effect is small and clinically unimportant, a P value can still be ‘significant’ in a large sample (Lantz, 2013), as with the present study's sample size. The risk for developing a type I error, incorrect rejection of a true null hypothesis, becomes bigger and affects the reliability of the analysis method used in the study (Sheldon, 2000b). Nevertheless, the problem with mass significance can solved by sharpening the limits for the P value from <0.05 to at least <0.01. This was not possible in ordinal regression analyses in the present study, because of the constraints of the software, and so instead odds ratios and 95% confidence intervals were reported. The odds ratio provides information on the risk of rating general health as bad depending on the studied variable. In addition, the P values presented are a measure of the ‘stability’ of the results (Wasserstein and Lazar, 2016).
Conclusions
The present study indicated that primiparous women reported higher self-rated health compared to multiparous women and those aged 35 years or older rated their health as low after pregnancy, although before pregnancy they had a higher estimation of self-rated health. Additionally, women between 25 and 29 years old were more likely to rate their health higher than other groups.
In midwifery, preventive actions building on awareness of possible associated factors are of great importance. Planning supportive actions for women who are likely to be vulnerable to poor postpartum outcomes such as physical or emotional ill health, as well as future morbidity, should be the priority of midwives, policymakers and stakeholders. By developing existing regulations, the health and wellbeing of women during and after pregnancy could be improved. Planning minimal interventions could lead to sustainable and accountable improvement of the health of all pregnant women in Sweden.
Regardless of the nature of interventions or preventive actions, they must be evidence-based. Further studies are needed, with more depth on the perspective and experiences of older pregnant women on what matters to them when they rate their health. A growing body of research evidence links self-rated health outcomes with future morbidity following childbirth. A self-rated health assessment provides an indication of individuals' subjective experience of their health. If the general health of pregnant women is compromised, other aspects of their health may also be compromised. Consequently, there is a need for a holistic intervention that includes all pregnant women and avoids compartmentalisation.
Key points
- The importance of giving women the possibility to express, prioritise and evaluate different aspects of their health cannot be overemphasised.
- Many factors influence the self-rated health of pregnant women, such as psychological stress, physiological changes and increased body mass index.
- Primiparous women reported higher self-rated health compared to multiparous women and women aged 35 years or older rated their health as high after pregnancy although they began their pregnancy with lower estimations of self-rated health.
- Preventive actions should be included in the development of existing regulations to improve the health of pregnant women, considering their resources and taking into account possible impacting background factors.
CPD reflective questions
- How can healthcare providers use mothers' feedback on their wellbeing to promote maternal health during pregnancy?
- What strategies do healthcare providers need to implement in the care provided based on the mothers' impacting background factors?
- What messages could be sent to policymakers to change existing health policies?